UPDATE 2 The sturdier version wasn't sturdy enough for many people, so I've tried to make it even more robust.
UPDATE I have updated the model, making certain parts of the design thicker so that it is easier to print. You can find the new version under the downloads tab - it's called "sturdier visualizer".
Objective: To picture the regions of the heart from which the bioelectrical signal (wave of depolarisation) is originating and use this to better interpret an ECG readout.
Audiences: Medical students, AP biology students, anyone who has recently had an ECG and is interested in learning where each of the signals is coming from
Preparation: A basic understanding of heart anatomy and the conducting system of the heart
Steps: Print and look.
Results: This is meant to be used a tool during an introduction to ECG interpretation. The next step (and potential assessment of what they learned) would be for the students to look at a real trace and determine the electrical axis.
As a part of my training to become a medical doctor, I have been tasked with learning to read an Electrocardiogram (ECG). This is an essential part of every medical student's physiology exam and indeed, is one skill that you pretty much know that you will get to use once clinical training has begun. Therefore, it struck me as terribly strange and, quite frankly, irresponsible that it was taught so badly, as the ability to quickly diagnose and localise a heart attack or other pathological heart condition could mean the difference between life and death.
All of the standard textbooks use the same empty phrases, the same 2D images showing the chest from the exact same frontal view. There are a plethora a Youtube videos but who has the time to search through them all to find one that will actually be useful (watching one on the topic takes roughly 15 minutes and what med student has that kind of time to spare?).
An ECG is a non-invasive technique that provides graphical representation of the electrical activity of the heart.
The ECG is a 2D trace on a piece of paper. Okay. But, my professors kept repeating that we have to imagine the electrical activity moving in 3D in order to understand what the different traces are telling you. There are typically 12 (sometimes just 6, sometimes 15, there could just be one) different traces originating from 9 different electrodes and 3 leads (Electrode = a physical terminus placed on the patient (either + or -); Lead = an imaginary axis created between electrodes with both a positive and negative terminus). The way you read it is you compare the different heights and orientations of the PQRS waves and use that to decide the direction in which the wave of depolarisation is travelling.
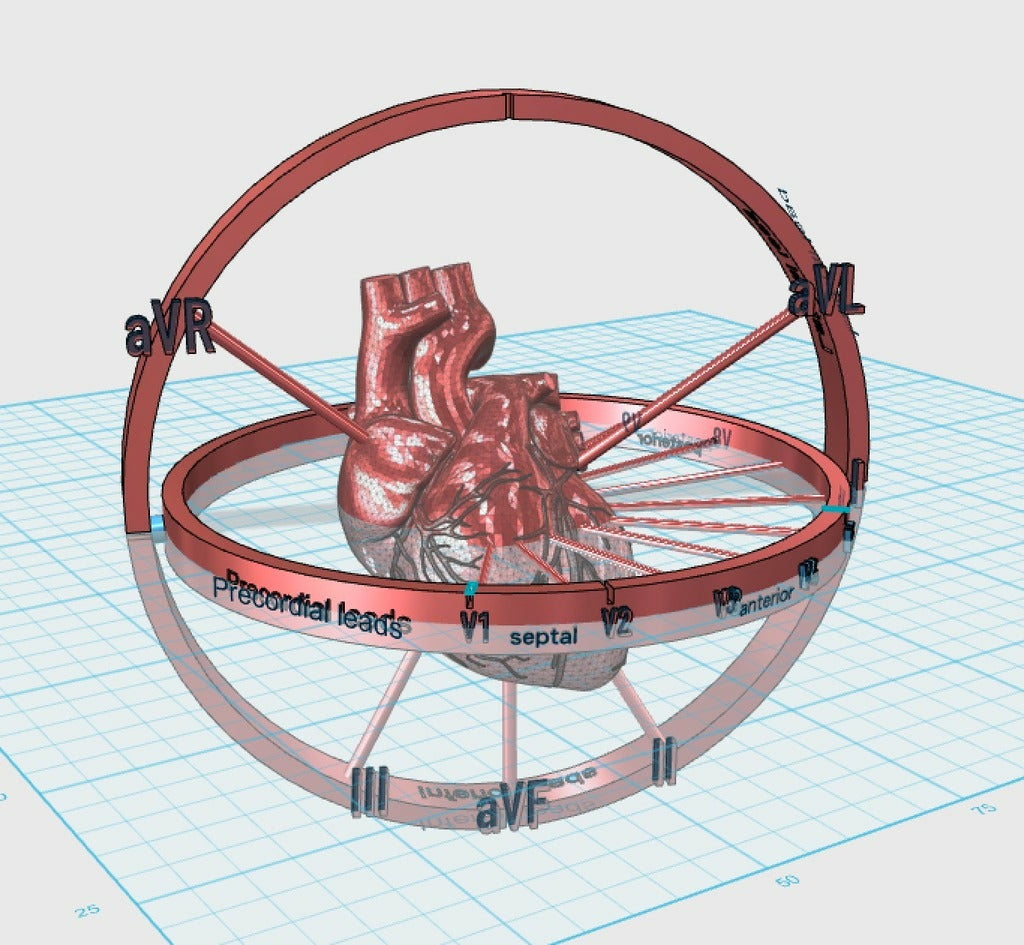
All the sources tell you where you should put the sticky pads of the electrodes on the body so that you can pick up the signal but it's more difficult to find and imagine where the signal is actually coming from. Now, this may have just been me, so please feel free to stop me at any point, shake you head at my stupidity and tell me that you can't believe I didn't get it from the diagrams but I felt that I needed to actually make a connection between the anatomy and what each of these stupid little lead abbreviations and numbers meant before I could even begin to look at a trace. I rejoiced when I found a little table on geekymedics.com that told me that, for example, V3 and V4 (the first two precordial leads) tell us about the electrical activity in the heart's anterior wall. Therefore, if I could combine what the faint ECG trace was telling me with some anatomical knowledge, perhaps I could figure out that the hypothetical patient's left anterior descending artery is the one with the obstruction.
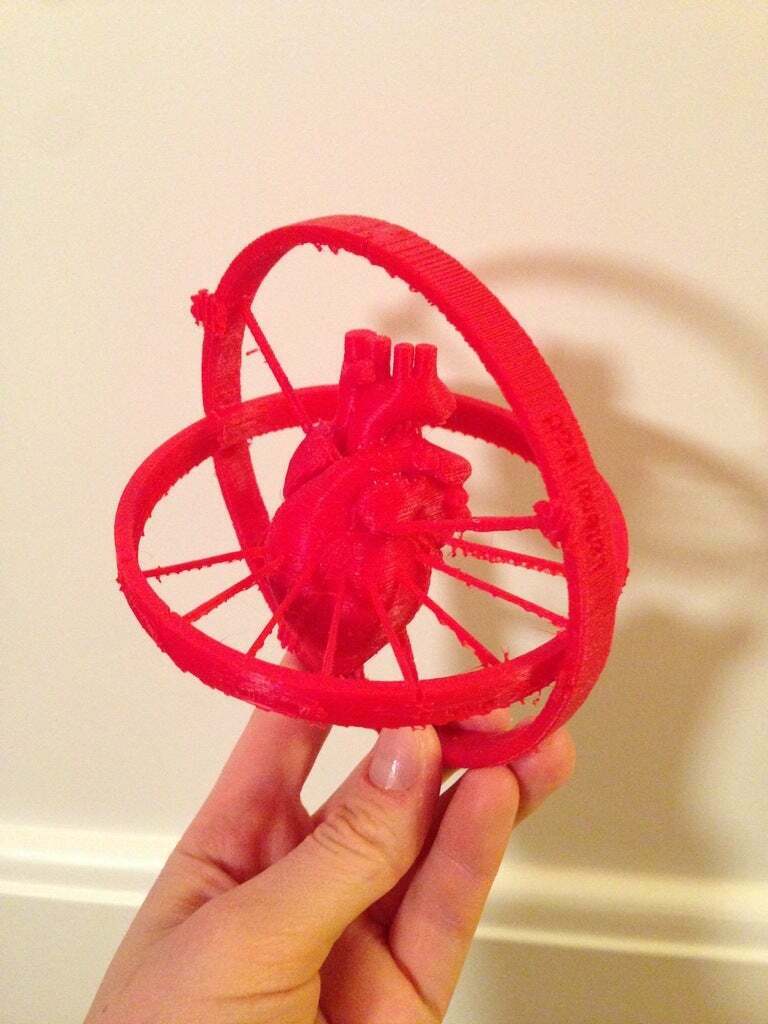
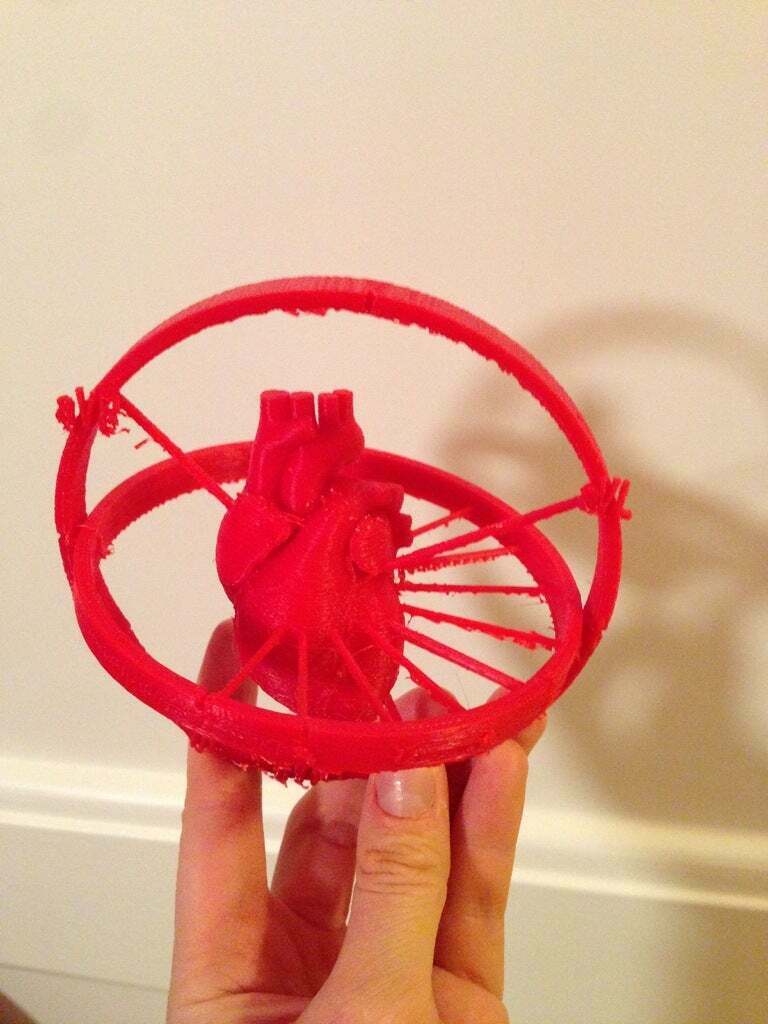
However, I still wanted to be able to imagine all of the leads and electrodes, all at once. So I designed this.
Now, it must be noted that the beautiful heart at the centre of the design was originally created by Mvetto (http://www.thingiverse.com/thing:426800) and this was then further modified by huntgatherer98 (http://www.thingiverse.com/thing:693895) to make it more solid and ergo more easily printable. This technically makes this a remix of a remix, however while the heart in the centre it gorgeous and wonderfully accurate, its purpose in this design is to give the viewer an idea of where the ECG leads are picking up their electrical signals from.
I haven’t printed it yet because I am on vacation away from my printer but I will be sure to do so when I get back in January.
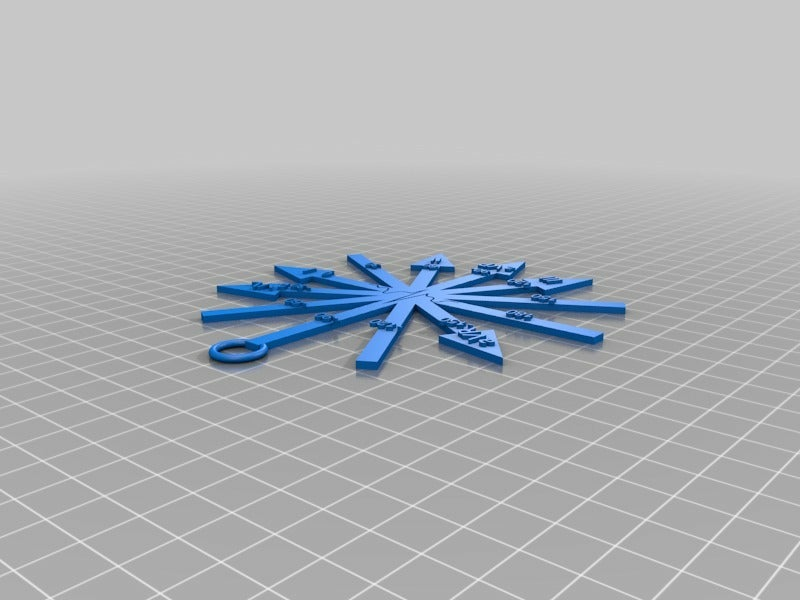
When I was a little blue at being unable to figure the damn thing out, I turned to 3D design and began by making a 360 degree quick little arrow dial based on that standard diagram that all the textbooks have. You can use it to figure out the mean electrical axis according to electrodes I, II, and III, and leads aVR, aVF and aVL. If the ECG trace for any of these has an inverted wave, that means that the signal is travelling in the opposite direction to it. If it is travelling perpendicular to it, it will show on the trace as a biphasic trace (the wave is small and resembles a sine wave more than a PQRS complex). I turned the design into a keychain in case any of you want it.
That’s all for now. I’ll surely be updating the design as more modifications occur to me. I welcome any and all suggestions. I’m still learning myself so if I made any errors please let me know so that I may correct them.
:format(webp)/https://fbi.cults3d.com/uploaders/4967864/illustration-file/f177c3a7-b69b-4e00-8e40-9c8418865e00/Screen_Shot_2015-12-25_at_13.45.44.png)


/https://preview3d-images.cults3d.com/variants/xi4ipr4gtruuim83bos4ivma6j07/cbbb7afd8a0ec9560f7f7940881f98c31dcb04582a03efcc135070de65821be8)
/https://preview3d-images.cults3d.com/urkun1wdb6nhfmwkmeah1t8dll3p)
/https://preview3d-images.cults3d.com/variants/c6kxy7oz9eop2f9i5h18cjyeqvcd/cbbb7afd8a0ec9560f7f7940881f98c31dcb04582a03efcc135070de65821be8)
/https://preview3d-images.cults3d.com/variants/rjkew5vtn0h72yx0ylrjoxs9o13w/cbbb7afd8a0ec9560f7f7940881f98c31dcb04582a03efcc135070de65821be8)


